Drainage networks: why point density changes the result
How the drainage network of a hillside is calculated from the terrain model, and what changes from 0.5 to 5 points per m², with an example in Xàbia (Jávea).
A drainage network is a drawing of where water runs when rain falls on a piece of land. Calculating it properly is the basis for designing ditches, collector drains and culverts on a residential estate, or for understanding why a plot floods or loses its soil with every storm. On the Alicante coast, with heavy autumn rain and terraced hillsides, detail matters. And the detail depends, above all, on the point density of the terrain model.
How is a drainage network calculated?
The starting point is a digital terrain model (DTM), the ground without buildings or vegetation. On it, a geographic information system (GIS) carries out four steps:
- It fills depressions that are not real, small hollows in the model where water would be trapped.
- It calculates the flow direction: towards which neighbouring cell water flows from each point, following the steepest slope.
- It calculates the flow accumulation: how many cells upstream drain into each point.
- It defines the network: the points that receive water from an area larger than a threshold form the channels.
The result is a map of lines that join together downhill, like the branches of a tree. With it you can see the main gullies, the points where water concentrates and the catchments that drain into each one.
What changes with point density?
The whole calculation depends on how faithful the DTM is to the real ground. And that depends, to a large extent, on how many measured points it has per square metre.
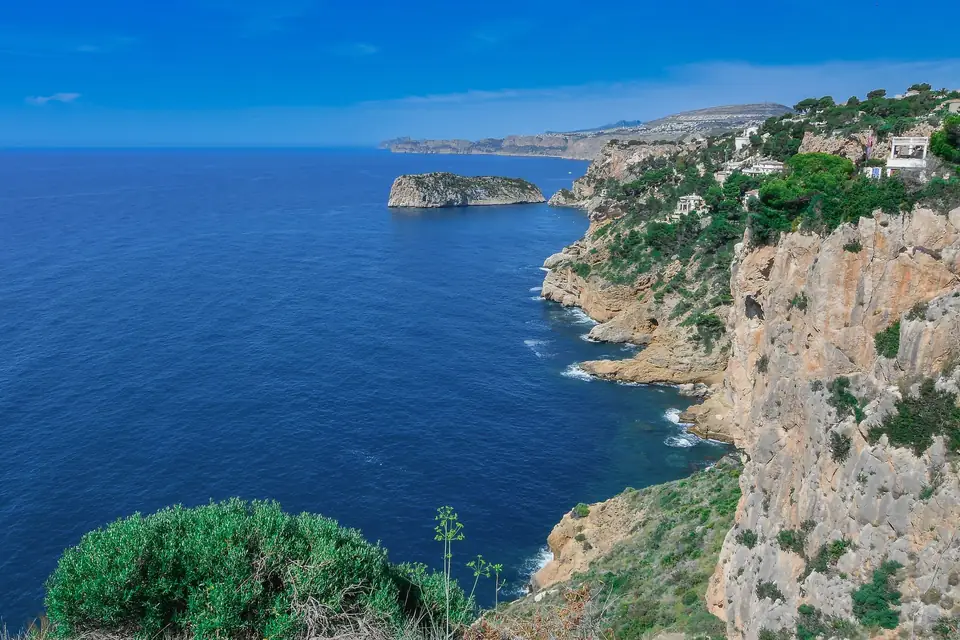
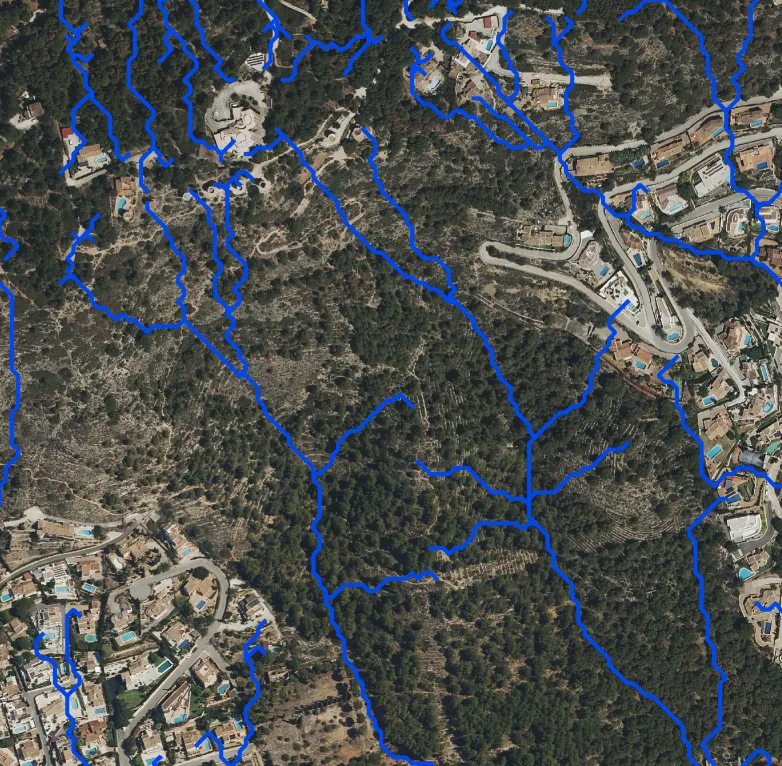
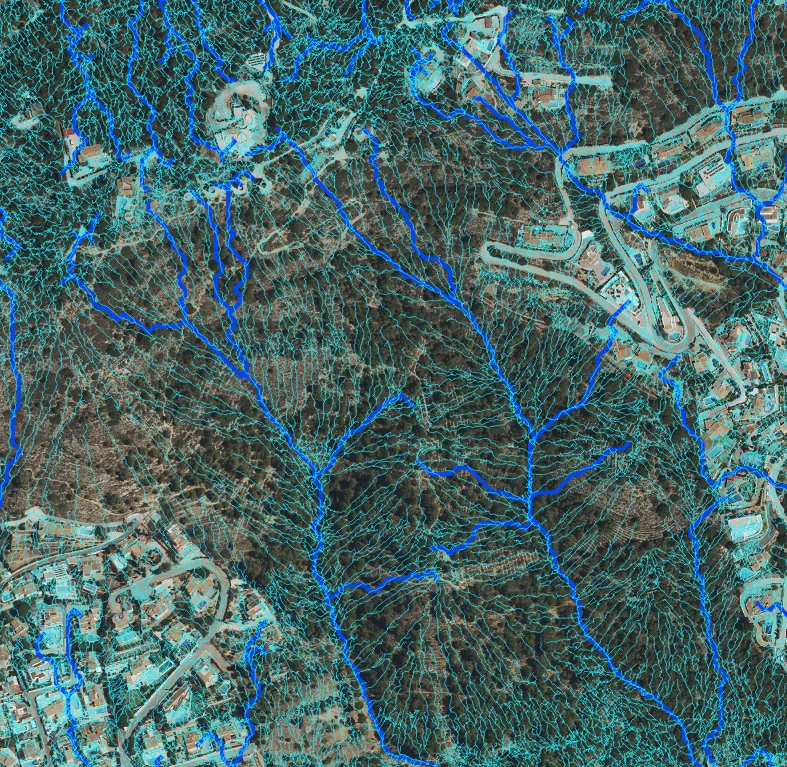
We compared this on a hillside in Xàbia (Jávea), with pine woodland, terraces and estate roads, by calculating the network with two models:
- A model of 0.5 points per m², a density of the same order as much public LiDAR data.
- A model of 5 points per m², ten times denser, like the one obtained from a dedicated flight.
What you see with low density
With 0.5 points/m², the model captures the general shape of the hillside. The network shows the main gullies and how they join. For an overview of a wide area, this can be enough.
What you see with high density
With 5 points/m², the model captures the terraces, the walls and the edges of the roads. The network fills with fine lines: this is the runoff coming down each terrace, which the roads collect and divert. It is exactly the information needed to design drainage at the scale of a residential estate or a plot: where to put a ditch, where to put a culvert, which wall is going to receive the water from the whole hillside.
The trade-off is the volume of data and the office work: ten times more points to classify and clean, separating ground, vegetation and buildings. That is why it is not always worth it. The density is chosen according to the decision that has to be made with the result.
What density do I need?
It depends on the scale of the decision:
| What for | Indicative density |
|---|---|
| Overview of a catchment or a municipality | Low, like public data |
| Planning a residential estate or a road | High, with a dedicated flight |
| Drainage of a plot, walls and ditches | High, supplemented with classic surveying at the critical points |
In how much a topographic survey costs we explain how the density of levels affects the work.
Why LiDAR for drainage?
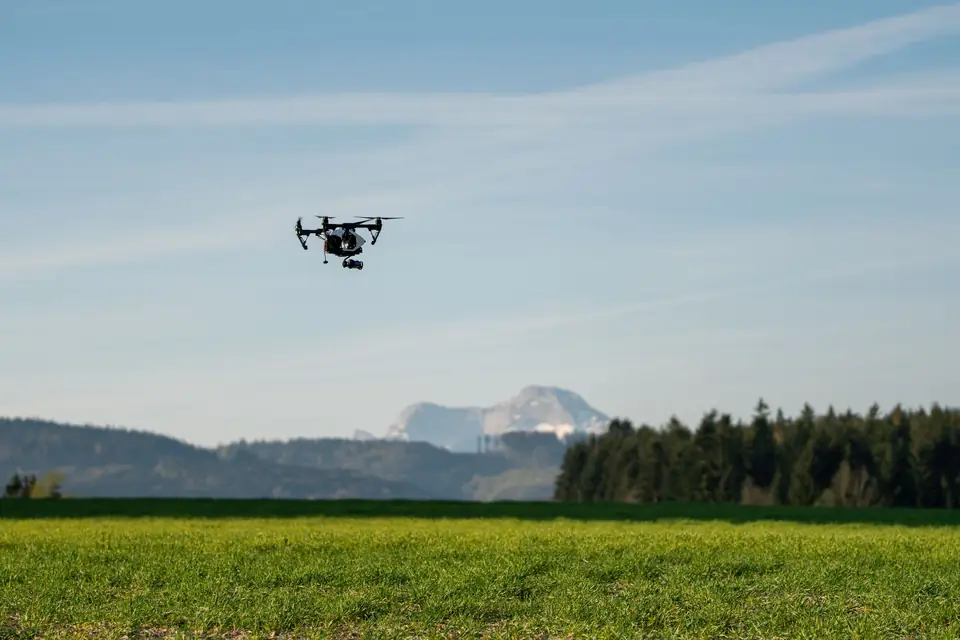
Because water runs along the ground, not over the treetops. Photogrammetry measures what the camera sees, and under pine woodland it sees trees. LiDAR reaches the ground through gaps in the vegetation and makes it possible to build a reliable DTM on wooded hillsides like those of la Marina Alta. We explain this in orthophoto, DTM, DEM and contour lines.
Frequently asked questions
Does a calculated drainage network replace a hydrological study?
No. The network tells you where water runs according to the relief. A hydrological study adds design rainfall, flow rates and return periods. The drainage network is one of its foundations.
Are walls and houses taken into account?
In the DTM the buildings are removed, but terrace walls and road edges are part of the ground and, with high density, they are captured. To study how a specific building affects the water, we work with specific models.
Will it tell me why my plot floods?
It is a good starting point. The network and the catchments show where the water reaching the plot comes from and where it concentrates.
We calculate drainage networks and other terrain analyses through cartographic analysis and GIS, using models obtained with LiDAR and point clouds.
Tags analisisdatosprecisionmapa
Written by Vicent Doménech, geodesy and cartography engineer, chartered surveyor no. 8948.