Shadow and slope analysis before you design
How we calculate the shadow cast by terrain, buildings and trees at each hour and season, and how a slope map shows where you can build on a plot.
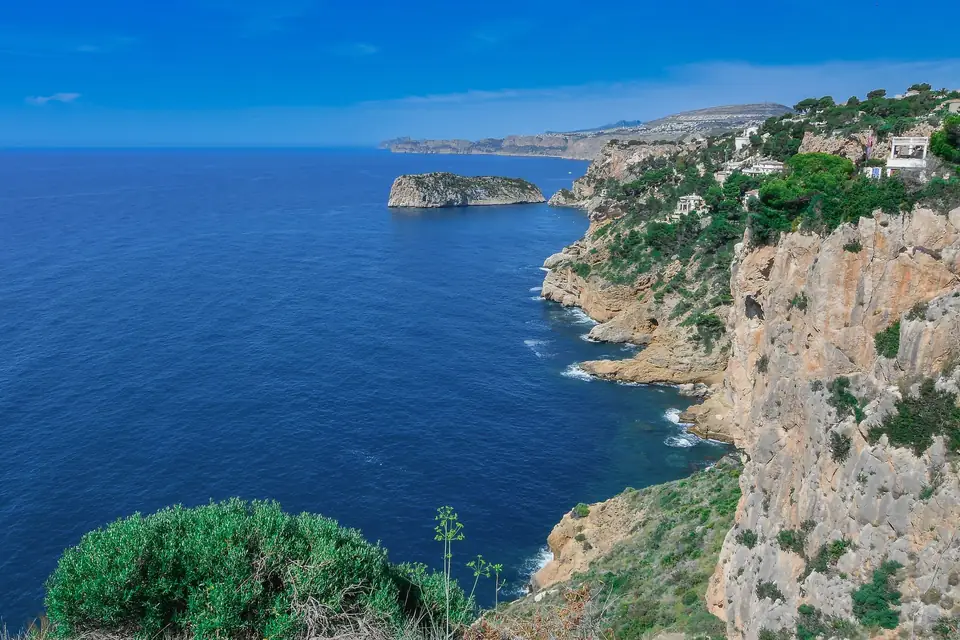
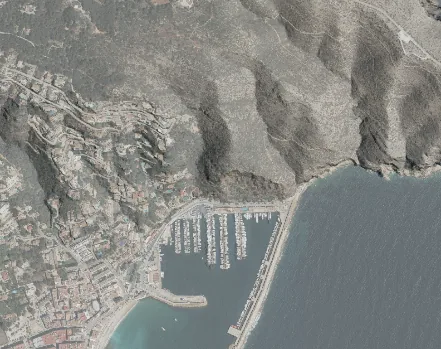
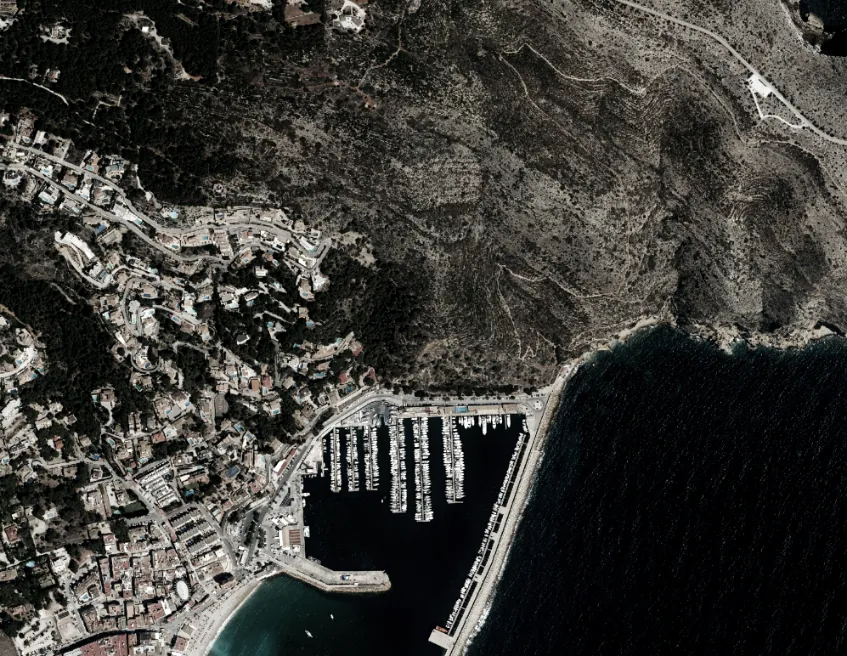
A shadow study tells you which parts of a piece of land get sun and which stay in shade at each hour of the day and in each season of the year. A slope study tells you how steep the ground is at every point. Both come from the same digital model and answer very practical questions before a project is drawn: where to put the house, the pool or the solar panels, and where you cannot build without retaining walls. We illustrate them with the area around the port of Xàbia (Jávea), between the bay and the hillside.
What is a shadow study?
To analyse how the sun falls on a piece of land, you need to know how shadows are cast depending on the position of the sun, the topography and the existing features. A shadow study shows the areas of shade and of sun exposure at different times of day and in different seasons.
What we do is work out digitally how the terrain, the buildings, the vegetation and other features affect solar radiation and create shadows over a specific area.
How is it calculated?
- We start from a digital surface model (DSM), which includes the terrain, the buildings and the trees. If only the terrain model is used, the shadow of a house or of a pine wood does not appear.
- We calculate the position of the sun (altitude and direction) for each date and time of interest: for example, the winter solstice, when the sun is lowest, and the summer solstice.
- For each position we calculate which areas are hidden from the sun by some feature.
- The results are combined into maps by hour or into maps of accumulated hours of sunshine.
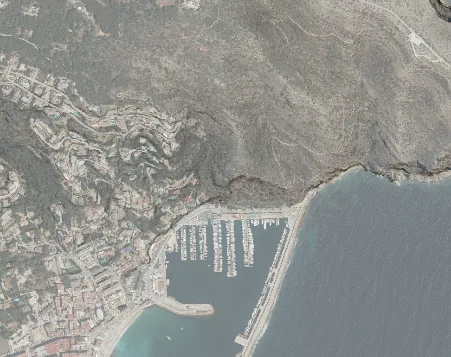
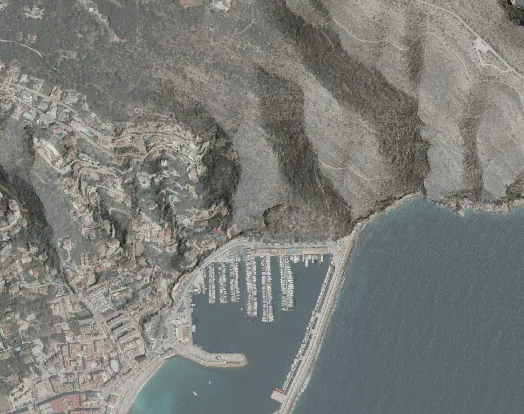
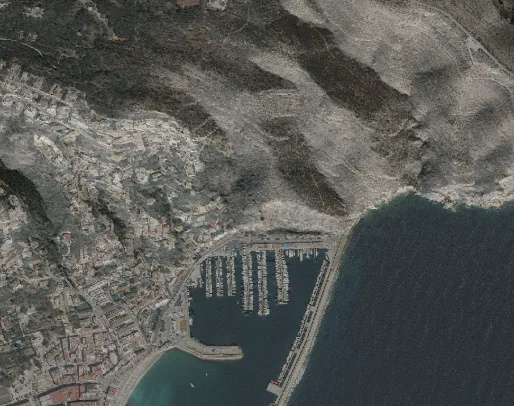
What is it for?
It is particularly useful for assessing the siting and orientation of new installations, with a prior study of how the sun behaves on the land and on the buildings:
- A house on a hillside: which façade gets sun in winter, which terrace is in shade on summer afternoons.
- A pool or a garden: how many hours of sun they will get depending on where they go.
- Solar panels: which part of the roof or the land is not shaded by the terrain or by trees.
- A new building: what shadow it will cast on the neighbouring plots.
On the coast, with slopes facing the sea and mountains behind, the difference in sunlight between one plot and the next can be considerable, especially in winter.
What is a slope study?
A slope map calculates, from the terrain model, the gradient at every point and classifies it into ranges. At a glance it shows where the ground is flat, where it is gentle and where it is steep.
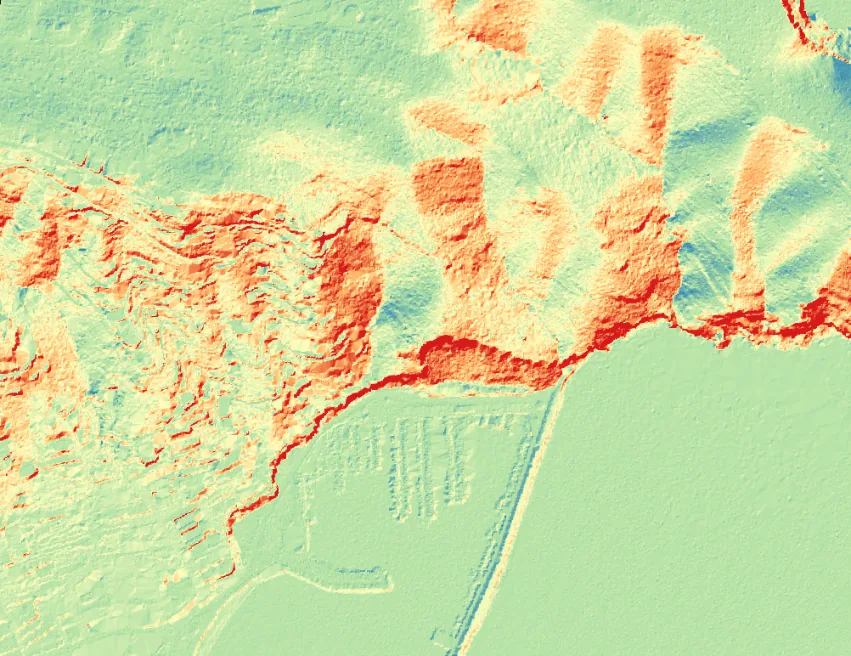
What is it for?
- Knowing where you can build without large earthworks.
- Designing access roads and ramps with gradients that can actually be used.
- Spotting risk areas: embankments and very steep slopes where walls are needed or where erosion is greater.
- Checking planning conditions, when the zoning plan limits building according to the gradient.
Combined with the drainage network and the viewsheds, the slope map completes the reading of the land before the project is drawn.
What data is needed?
- A terrain model for the slopes and a surface model for the shadows, with a resolution suited to the scale of the analysis.
- The dates and times of interest for the shadow study.
- If a future building is being analysed, its volume and height.
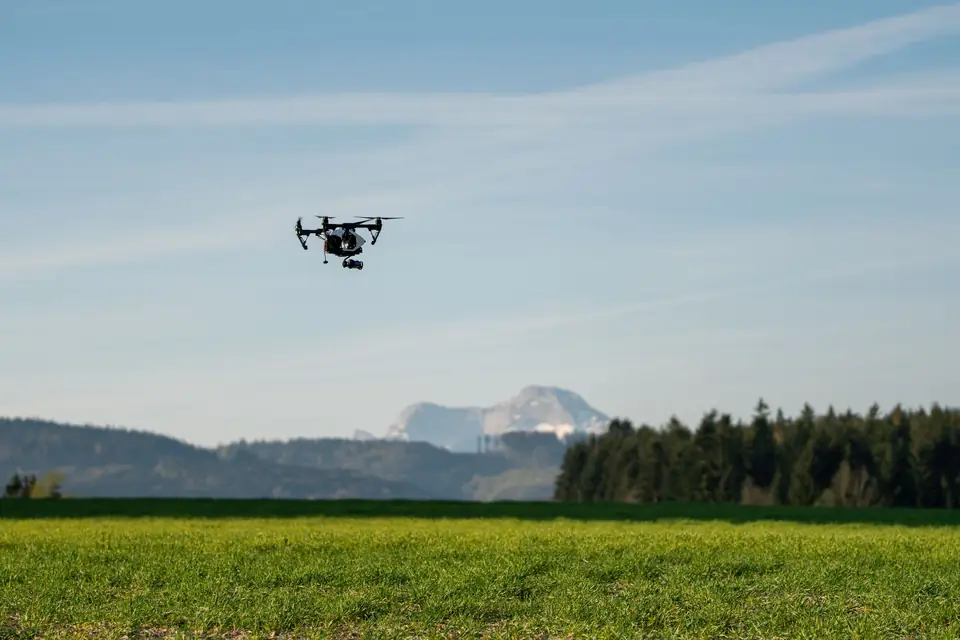
For a plot, the ideal is our own drone flight, which captures the trees and buildings as they are today. For large areas, public data can be combined with detailed surveys.
Frequently asked questions
Does the shadow study take trees into account?
Yes, if it is done on a surface model. That is one of the reasons for a new flight: trees grow and old data does not capture them.
Can you simulate the shadow of a house that does not exist yet?
Yes. The planned volume is added to the model and the calculation is the same. That way you can compare orientation or height before deciding.
Which slope ranges are used?
They are chosen according to the question: those set by the zoning plan, those for the accessibility of a path, or those that separate flat, gentle and steep ground. We agree them with whoever commissions the study.
We carry out shadow and slope studies as part of our cartographic analysis and GIS work, based on digital terrain and surface models.
Tags analisismapatoma de decisiondatos
Written by Vicent Doménech, geodesy and cartography engineer, chartered surveyor no. 8948.