Orthophoto, DTM, DEM and contour lines explained
What makes an orthophoto different from an aerial photo, a DTM from a DSM, and what contour lines are for, with a large hillside site in Xàbia (Jávea).
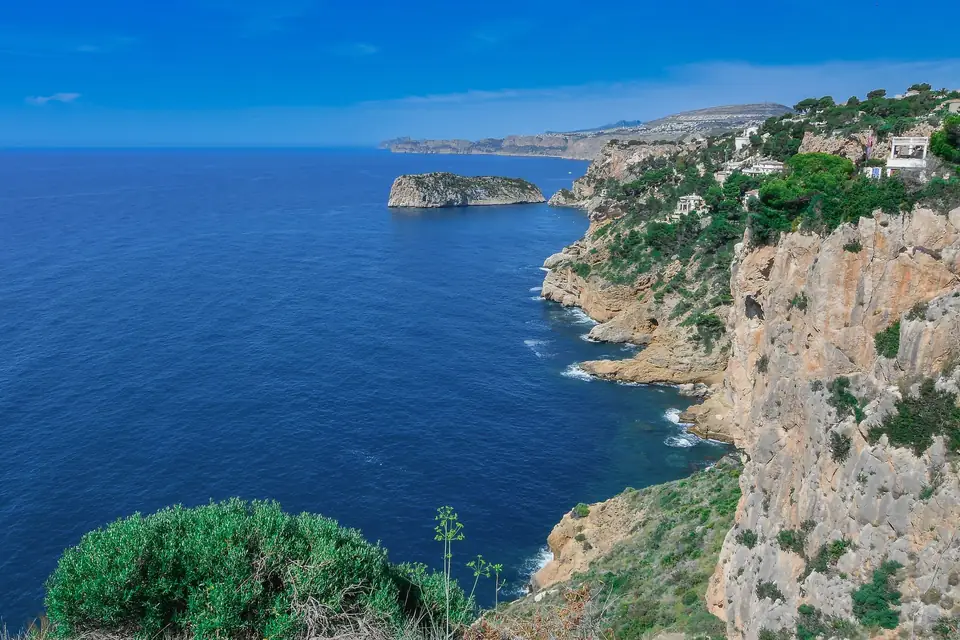
Orthophoto, DTM, DEM, DSM and contour lines are the products used to describe a piece of land from the air. They are requested often and confused even more often. Here we explain what each one is, how they differ and what they are used for, with images of a hillside in Xàbia (Jávea) and the case of a study for an urban development in the same area.
What is an orthophoto?
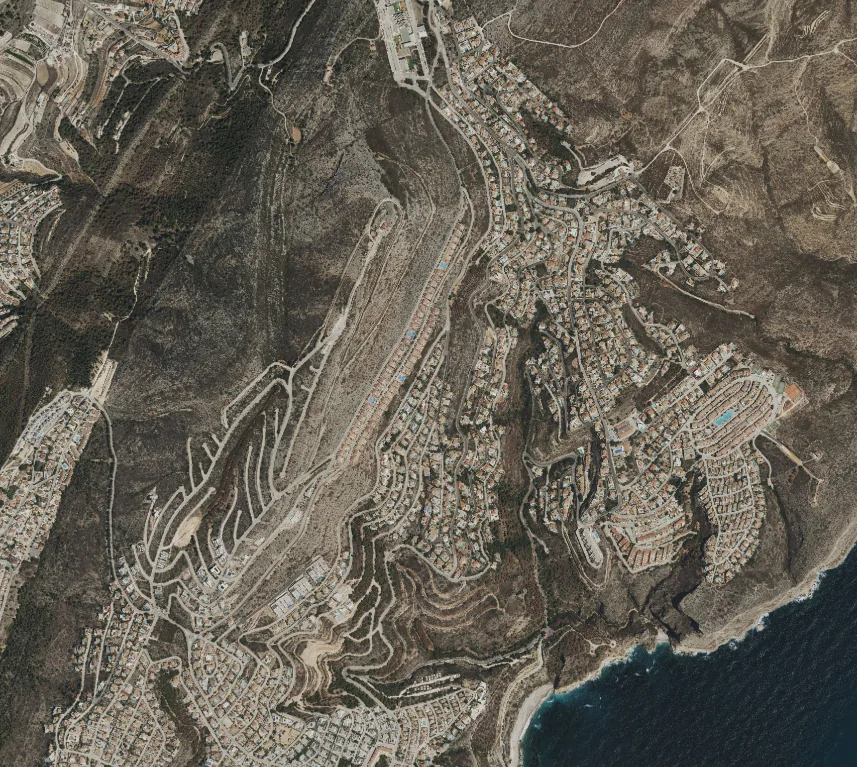
An orthophoto is an aerial image corrected so that it has the same scale at every point. An ordinary photo distorts: whatever is higher or closer to the edge appears displaced. The orthophoto removes that effect using a model of the terrain, so you can measure on it as you would on a plan.
When the orthophoto is assembled from many photographs taken on a drone flight, we call it an orthomosaic. If the flight is tied to points measured on the ground, the orthomosaic has metric quality: the distances and positions you read on it are reliable.
What is a DEM, a DTM and a DSM?
They are digital models: a grid of points, each with its elevation, that describes the shape of the ground.
- DEM, digital elevation model (MDE in Spanish): the general name for any height model. In everyday work, many of us use it to mean the surface model.
- DSM, digital surface model (MDS): the elevation of the first thing found from the air. It includes roofs, trees, walls and cars.
- DTM, digital terrain model (MDT): only the bare ground, without buildings or vegetation. This is the one used to design, calculate volumes or draw contour lines.
The difference between the DSM and the DTM is the height of whatever stands on the ground. With it you can calculate, for example, the volume of vegetation on a plot.
And contour lines?
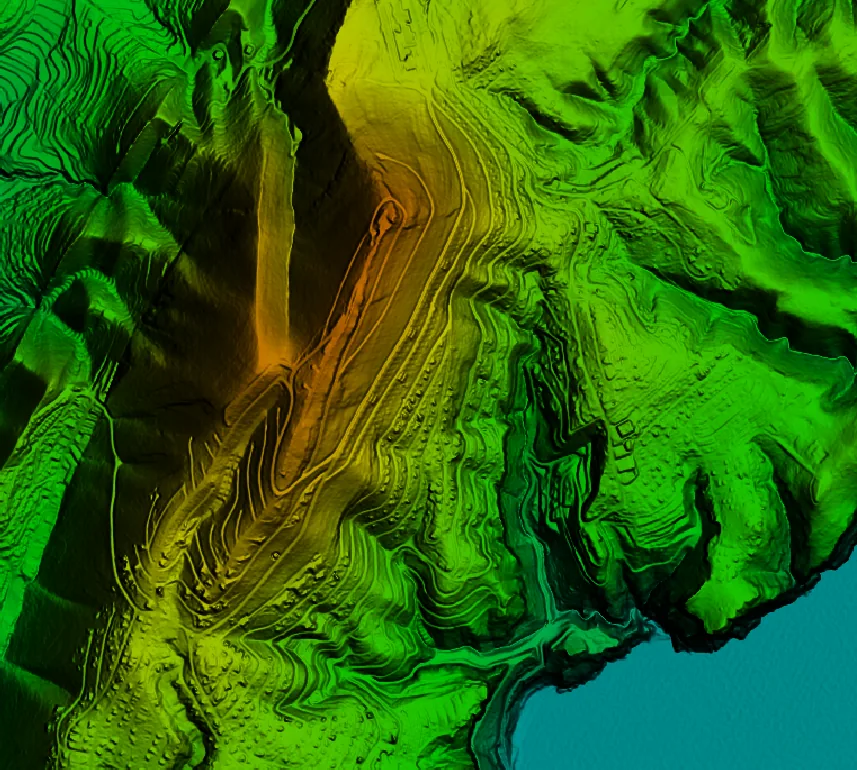
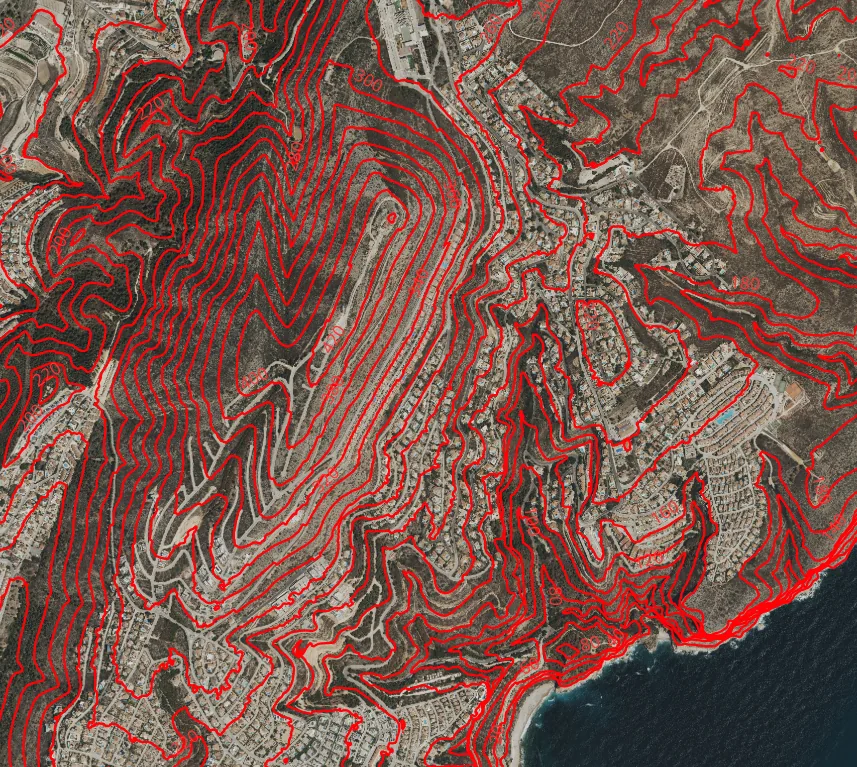
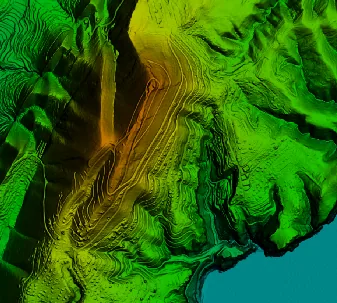
Contour lines are lines joining points of the same elevation, separated by a fixed vertical distance called the contour interval. The closer together they are, the steeper the slope. They are generated from the DTM and are the classic way of reading relief on a plan: the architect uses them to position a house, the engineer to lay out a road and the landscape designer to understand how water runs downhill.
Photogrammetry or LiDAR?
Both are done with a drone, and they complement each other:
- Photogrammetry reconstructs the ground from overlapping photos. It produces the orthophoto and a very detailed surface model, but it only sees what the camera sees: under dense pine woodland, it sees treetops.
- LiDAR measures with laser pulses. Some of the pulses pass through gaps in the vegetation and reach the ground, so it gives you a reliable DTM even under trees.
On a coastal hillside, with pine woodland, terraces and houses, the usual approach is to combine both.
The case: a large site in Xàbia for an urban development
To plan an urban development, the client needed detailed knowledge of the ground across a large area, on a slope and with a lot of vegetation.
What we did
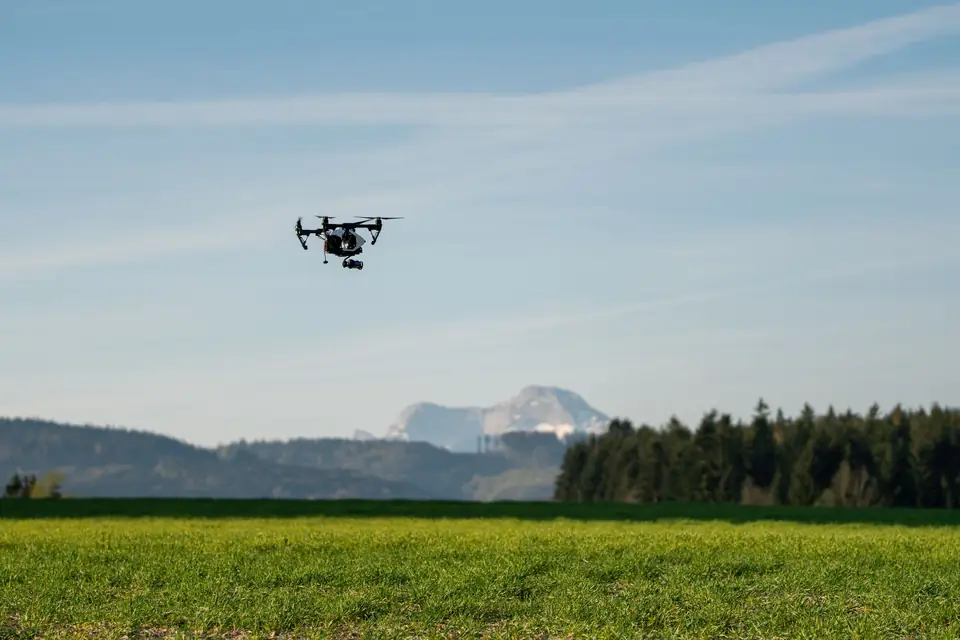
A photogrammetric and LiDAR flight by drone over the whole area. From the photographs we generated the orthomosaic with metric quality; from the LiDAR point cloud, the DTM, and from the DTM, the contour lines.
What we delivered
The orthophotos and the contour lines of the site.
What it was used for
It was the base information for the urban development study: on it, slopes, access routes, buildable areas and drainage are analysed before anything is drawn.
Frequently asked questions
Is the public PNOA orthophoto not good enough?
To get a general idea, yes. For design work, usually not: the resolution and date of the PNOA (Spain’s National Aerial Orthophotography Plan) images are not always sufficient, and they do not show the current state of the ground. A dedicated flight gives more detail and today’s picture.
What contour interval do I need?
It depends on the use and the scale of the plan. For a house we work with small intervals; for planning a large area, with larger ones. We agree it with you before we fly.
In what format do I receive the models?
The models, as GeoTIFF or point cloud (LAS or LAZ); the contours, in DWG, DXF or SHP; the orthophoto, in GeoTIFF. We explain this in what formats a land surveyor delivers.
If you need a terrain model or an orthophoto of a property or of a wider area, we produce them with DTM, DEM and 3D models and with drone orthophotography and photogrammetry.
Tags topografiamapageorreferenciaciondatos
Written by Vicent Doménech, geodesy and cartography engineer, chartered surveyor no. 8948.