Mapping and surveying · · Updated on
Topographic data sources: imagery, orthophotos, open data
An overview of the main sources of geopositioning and topographic data: satellite imagery, orthophotos, spatial data infrastructures and open data.
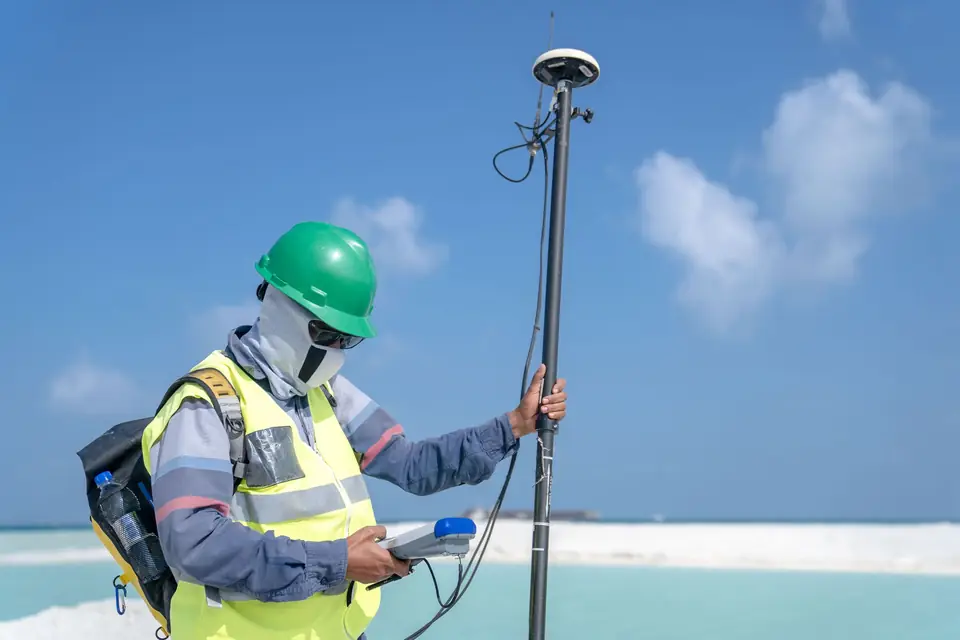
There are organisations at global level that open up the use of and access to data in order to make it easier to start new ventures, improve technological fields and generate wealth. By opening up access to this information, the aim is to move towards a better world through innovation.
Satellite imagery
At global level there are organisations such as the USGS and the ESA that periodically publish satellite imagery of the whole world. The pixels of these images usually represent between 15 metres and a few centimetres. There are image collections available at no cost.
Orthophotography
There are state bodies such as the IGN (Spain’s National Geographic Institute) or the ICV (the Valencian Cartographic Institute) that provide aerial images corrected for distortion. These images are known as orthophotos, and their distinctive feature is that measurements can be taken on them. This is possible because the scale of every element is the same and they are free of deformation and error, so they have the same validity as a cartographic plan.
Spatial data infrastructures (SDI)
Other state bodies provide spatial data infrastructures (SDI, known in Spain as IDEE), which represent features of the territory and are provided in WMS format. The Cadastre (Catastro, Spain’s land and property register for tax purposes), land use, the transport network, flood risk maps, biodiversity or environmental quality and assessment are examples of the mapping available for analysis. All this information can be analysed to make the most of it and take better business decisions.
Open data
There is also collaborative mapping produced by a global community of users. These communities record information in a shared database. In principle the information comes from the interpretation of satellite imagery, orthophotos or SDI data, but also from capture with mobile phones that determine their position by GPS. One example is OpenStreetMap. This mapping includes records of businesses, such as supermarkets or hospitals, as well as a road network that allows delivery routes to be optimised or catchment area analyses to be carried out. It serves as the base for projects as powerful as Google Maps.
Public administrations such as town councils have realised the wealth that publishing this type of information brings. Cities such as Madrid, Valencia, Seville and Santander publish information such as environmental quality or real-time traffic intensity. One example is Valencia City Council’s Dades obertes initiative.
The data sources mentioned above have a geographic component that allows very detailed spatial analysis. They can also be related to other sources of information, provided there is a way to link them. One example is the information from the INE, Spain’s National Statistics Institute, which holds data broken down by administrative unit (provinces or cities).
Tags analisisdatosmapatoma de decision
Written by Vicent Doménech, geodesy and cartography engineer, chartered surveyor no. 8948.